Check out this report: Snapshot Comparison Backtesting - A detailed breakdown of our Ai Algo's Historical Performance
Created this new report that you must checkout. It shows the amazing performance of our Ai Algo versus the benchmark and we outperformed big time.
As you know, I’m making a bunch of historical reports of the new Ai Algo’s performance in the past. It’s painstaking amounts of work to clean up a ton of data to accurately reflect what exactly would have played out if we used this tool in the past. The reason it’s important to do this accurately is to give our Ai model a ton of good data from the past so it can perform better in the future. Therefore, I have shown every bit of detail in these reports and cleaned up any data that would lead to inaccurate reporting (eg. splits can show inaccurate price if it’s not factored in)
The way I do this without any bias is to first take a snapshot of a point in time in the past, then find a high or a low of the market for a time in the future from the original date. Take snapshots of every stock at both points and find the Ai Algo’s parameters the way they looked at both those points. Then simply compare the price changes to see which parameters actually performed, do this over and over to see which parameters are credible. Doing this across many timeframes is how I came up with our Ai Algo Ranking and Prediction tool in the first place but now we are now getting to a point where the tool is just becoming perfect.
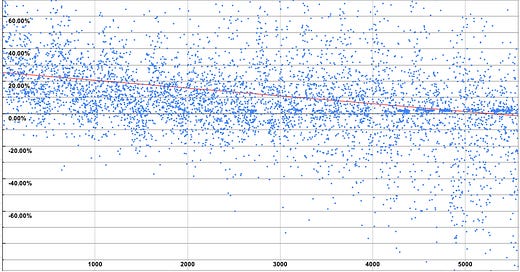
I’m now generating these reports to show even more detail so I can tweak things even further if need be. Here is our first report, it shows everything including a scatter plot of every stock with our Ai Algo Rank on the X-axis with percentage change of stock during that timeframe to show performance on the Y-axis.
As you can clearly see from the image above, our Algo works!!! The top-ranked stocks are clearly what performs and as the stocks get ranked lower the performance is more scattered but mostly down. The red trendline shows that as well. This is not just any average performance, it’s showing to outperform the SPY buy 3X. You could have literally picked any stocks in a collection of 50-100 stocks in the top 1000 ranked stocks and you would have beat the S&P 500 by 3x and at least double virtually all other major benchmarks.
So without further ado, check out this report:
It’s also a PDF report so you can zoom in and out as there is a ton of data to digest. I’d love feedback for anyone who would like to share it.
Thanks,
Sohin


I am unable to logon to my paid account. This is very frustrating. Why can you not take care of Basic things for your paid subscribers?
Stockgpt is outdated by 1 year! just check price of TECL or other levraged ETFs