Another Snapshot Comparison Backtesting - A look at a downtrend.
Created this new report that you must checkout. It shows the amazing performance of our Ai Algo versus the benchmark in a downtrend.
I have a new report for you on our performance in a downtrending market. In the last report, I shared how we would have outperformed the S&P 500 by 4x when the market is going up. It showed during the timeframe compared we would have made almost 40% while the market only went up by 10%. If you haven’t reviewed that check it out here.
In this report, we’ll take a look at what happens when the market loses about 8%, let's see how we do then. This is my way of being open and transparent about the potential downside of the Ai Algo and the only reason I’m comfortable sharing all the recommendations in the first place, is because the performance across all timelines is just great!
As you know, I’m making a bunch of historical reports of the new Ai Algo’s performance in the past. It’s painstaking amounts of work to clean up a ton of data to accurately reflect what exactly would have played out if we used this tool in the past. The reason it’s important to do this accurately is to give our Ai model a ton of good data from the past so it can perform better in the future. Therefore, I have shown every bit of detail in these reports and cleaned up any data that would lead to inaccurate reporting (eg. splits can show inaccurate price if it’s not factored in)
The way I do this without any bias is to first take a snapshot of a point in time in the past, then find a high or a low of the market for a time in the future from the original date. Take snapshots of every stock at both points and find the Ai Algo’s parameters the way they looked at both those points. Then simply compare the price changes to see which parameters actually performed, and do this over and over to see which parameters are credible. Doing this across many timeframes is how I came up with our Ai Algo Ranking and Prediction tool in the first place but now we are now getting to a point where the tool is just becoming perfect.
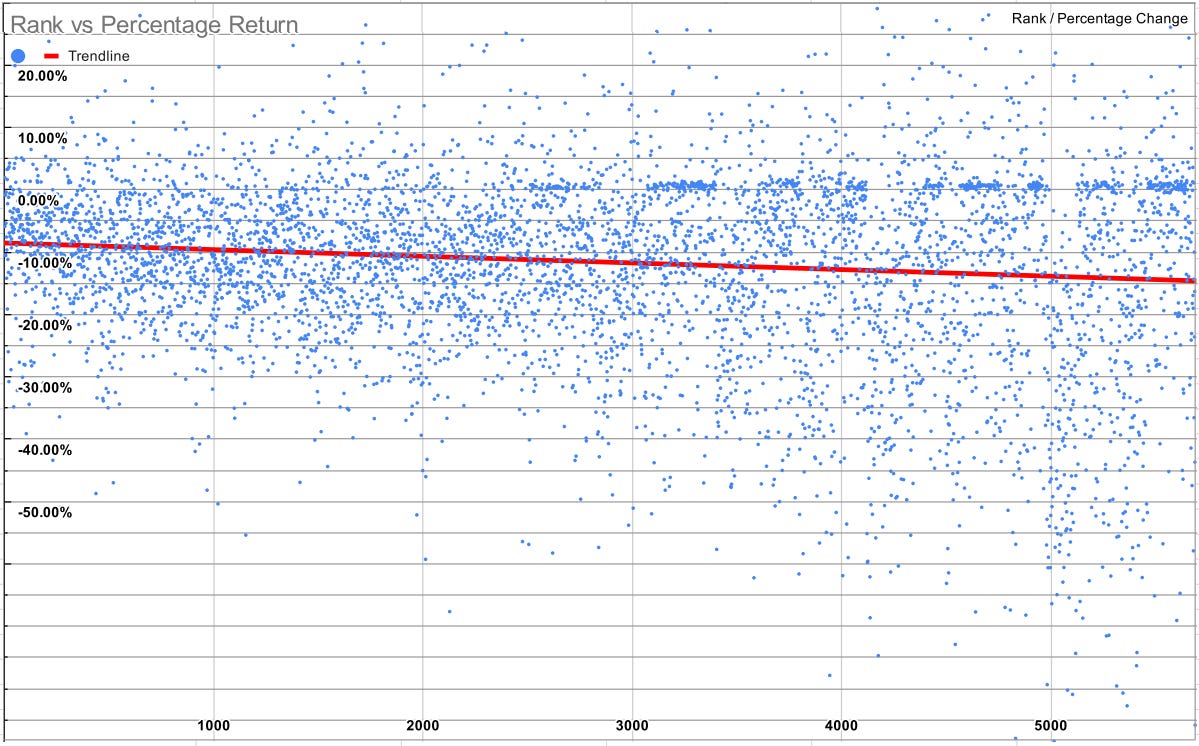
I’m now generating these reports to show even more detail so I can tweak things even further if need be. Here is a snippet from the report, it shows everything including a scatter plot of every stock with our Ai Algo Rank on the X-axis with percentage change of stock during that timeframe to show performance on the Y-axis.
As you can see from the image above, our Algo works in a downtrend too. In the report, the data shows we would not have made money, but not losing as bad as the benchmark and other stocks is still a great outcome!!! The top-ranked stocks are clearly what shows to perform and as the stocks get ranked lower the performance is more scattered but mostly down. The red trendline shows that as well since it’s going down as the rank position is higher. This is not just any average performance, it’s actually incredible given that most strategies that beat the market in an uptrend, get crushed in a downtrend. Not here :)
So without further ado, check out the full report:
It’s also a PDF report so you can zoom in and out as there is a ton of data to digest. I’d love feedback for anyone who would like to share it.
Thanks,
Sohin


thanks sir. ai algo rank will refresh the day meanwhile?